001: Discarding the Batch Paradigm, Part 1
Introduction
I remember watching demos of Common LISP’s SLIME interface ten years ago (stay with me, this is about C, I promise). It had live reloading features that just seemed magical. Smalltalk also had some incredible features for live-reloading and environment introspection. There have been countless other systems like this built over the years. The common thread is the notion of a contextually aware environment. The environment provides a persistent entity that works with you to understand, iterate on and test your program.
For various reasons, this more iterative style of development has not become the norm. The batch paradigm, with it’s lineage going all the way back to punch cards, remains dominant. This is especially true in the world of C and C++. One primary reason for this, in my view, is the state of compile times in most projects. Sometimes, when things are bad for so long, people begin to believe that there exists an intrinsic quality which necessitates the status quo. This is how things feel if you look around the C and C++ worlds. If we take a step back to examine this more quantitatively, we can quickly determine that this is not an inevitable conclusion.

Pre-emptive Peanut Gallery Q&A
Maybe computers just aren’t fast enough yet?
| No. Computers are incredibly fast, to a degree we often lose grasp of. There is no good reason builds should be taking multiple minutes. Video games are computing physics simulations, rendering models & textures, processing and mixing audio -- often every 16 milliseconds. We can process some text, evaluate it, and output an executable. |
Maybe it is inherent to compiled languages?
| No. There are plenty of existence proofs of natively compiled languages with excellent build performance: Nim, Jai, and Go come to mind. |
Maybe it is inherent to C or C++?
| No. With careful, informed setup, C and C++ can compile very quickly. |
Is this using some esoteric compiler/toolchain that will become abandonware?
| No. First, I'm not releasing any code in this post, so there is nothing to abandon. Second, the techniques and results shown will be done with Clang, CMake and Ninja; these three are probably the most popular compiler, and build tools in use on non Windows platforms (though they are usable on Windows, and I recommend moving off of MSVC if possible). If you are primarily using Windows and Visual Studio, then I highly recommend checking out Sebastian Shöner's excellent blog post on this. |
This build is already pretty fast, it won’t apply to my special repo!
| The important takeaways here are the actions you can take, and speed numbers should be considered in relative terms, not absolute. |
Measurement
Just like any performance evaluation, our intuition can quickly lead us in the wrong direction, so it’s important we measure things and let that guide our process.
Setup
There are two primary tools we will utilize for our measurements.
¬ A python script made by a Github user named Nico, available here.
¬ The web site https://ui.perfetto.dev/ (you can also use chrome’s chrome://tracing).
Additionally, we must update our CMake configuration to output the necessary metadata via
Aras’
wonderful -ftime-trace argument which outputs a .json file next to each
compilation unit generated:
add_compile_options(-ftime-trace)
I have an additional python script we will use in a bit:
# sort_profile_data.py
import os, json, sys, pprint

assert(len(sys.argv) == 2)

path = sys.argv[1]

with open(path, 'r') as handle:
    ordered = list(reversed(sorted(json.loads(handle.read()),
                                   key=lambda o: o['dur'])))
    pruned = []
    index = 0
    for i in range(0, len(ordered)):
        # grab top level categories only
        ordered[i]['tid'] = index
        ordered[i]['ts'] = 0
        index = index + 1
        pruned.append(ordered[i])

    print(json.dumps(pruned))
Before measuring a build, we need to make sure there are no remnants left in an existing build directory. Ninjatracing, by default, will just take the last run, even if its incremental.
ninja clean
rm .ninja_log
Then run the build as usual (ensure we are using clang and ninja here)
cmake -GNinja -DCMAKE_BUILD_TYPE=Debug -DCMAKE_C_COMPILER=/usr/bin/clang -DCMAKE_CXX_COMPILER=/usr/bin/clang++ ..
ninja
Next we can use the ninjatracing script to process the output .ninja_log file.
By default, the build will output just the top level modules. This is a good place to start
and get a lay of the land.
python3 ninjatracing.py .ninja_log > top_level.json
Level 1: Build system changes
Let’s examine the output at the start. 5.46 seconds, certainly not horrible2, but not what it should be, particularly if our long term goal is a build fast enough to re-compile on keystrokes, à la Tomorrow Corporation. This first set of optimizations will be done at the CMake level, the next set will be edits on the code itself. Moreover, it is important to consider the improvements in relative terms, as the lessons here will scale to larger problems.
$ time ninja
________________________________________________________
Executed in    5.46 secs    fish           external
   usr time   57.30 secs    0.00 micros   57.30 secs
   sys time    8.05 secs  251.00 micros    8.05 secs
Lets run the ninjatracing script and see what our top level has to show us.
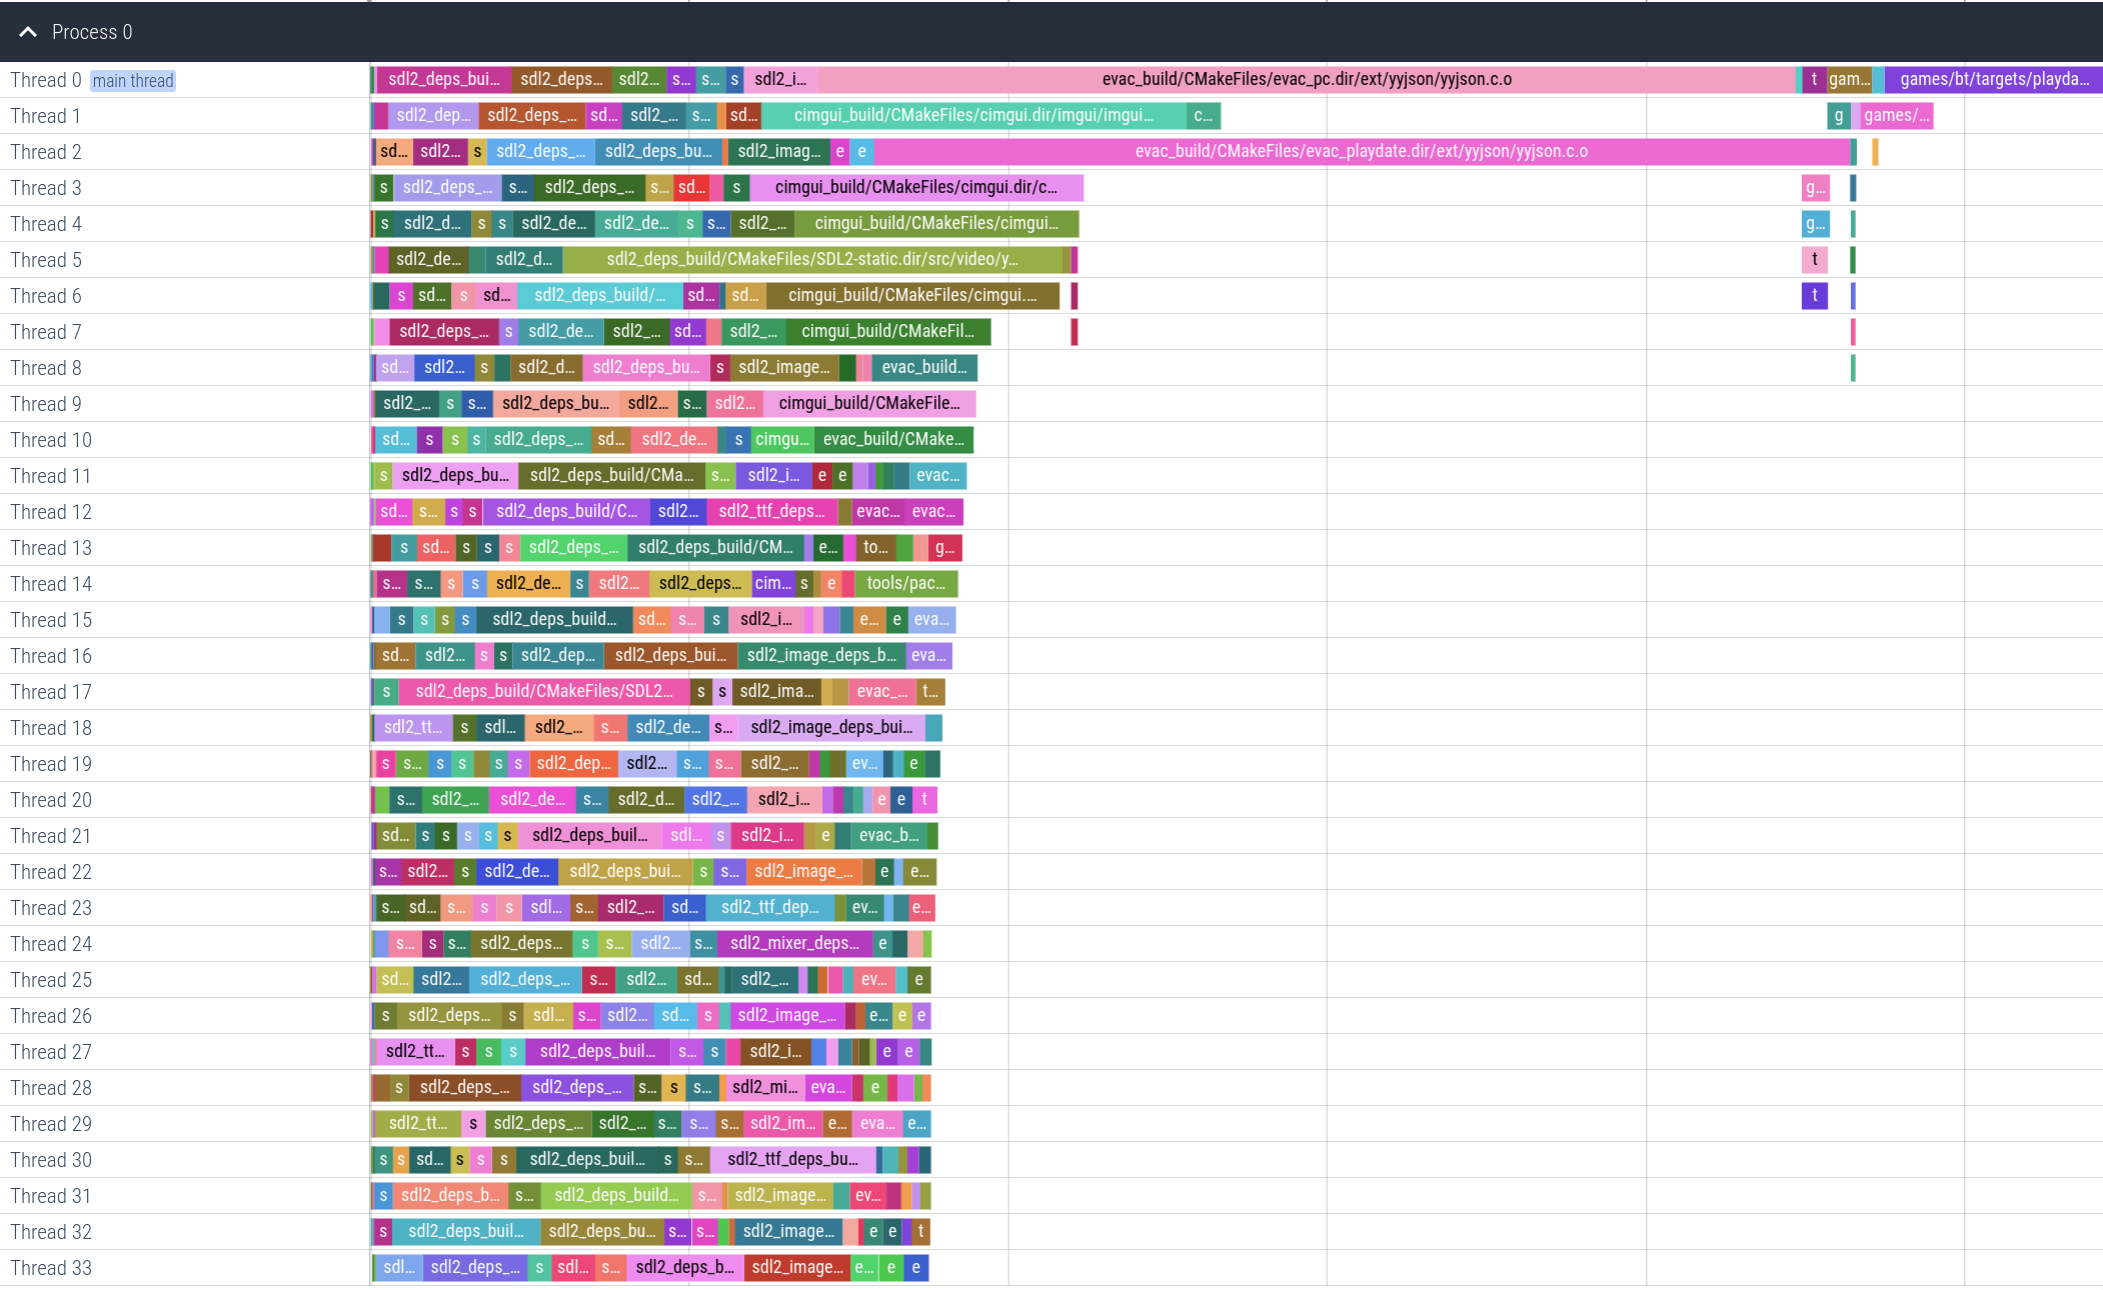
Something that quickly jumps out here is our usage of yyjson. While I think this library
does a good job and is the best C (not C++) library available, its compile time is wholly
disproportionate compared to the computational task it provides.
This brings about a useful flowchart for approaching optimization in a build
context at a top level.
                              ┌──────────────────────────┐
                              │                          │
                              │ Do I actually need this? │
                              │                          │
                              └┬─────────────────────────┘
                               │
                               │
                               │
                               │
                               │
                               │
┌──────────────┐               │            ┌────────────────────────────┐
│ Delete it :) │  ◄─────No─────┴────Yes───► │ Is it frequently changing? │
└──────────────┘                            └┬───────────────────────────┘
                                             │
                                             │
                                             │
                                             │
                                             │
                                             │
                                             │              ┌───────────────────────┐
                   ┌─────────┐               │              │                       │
                   │ Bake it │ ◄─────No──────┴────Yes─────► │ Level 2 Optimizations │
                   └─────────┘                              │   See next section    │
                                                            │                       │
                                                            └───────────────────────┘
In the case of yyjson, it is never changing. It is a vendored dependency. So we can
certainly bake it. Given we know the set of platforms and architectures we support, doing
so is simple. Go grab the .o generated in the build and build an archive with it ar r yyjson.a yyjson.o, and
save that per platform somewhere in your repository. Once you’ve checked these archives into
the repository, you can remove the .c from your build sources.
Then we can make a cmake macro (note you can do this as dynamic libs as well):
macro(_evac_baked_lib bin_name lib_name id ext)
  add_library(${lib_name} STATIC IMPORTED)
  if(evac_host_platform_linux)
    set_target_properties(${lib_name} PROPERTIES IMPORTED_LOCATION ${CMAKE_CURRENT_SOURCE_DIR}/ext/${id}/linux/${id}.${ext})
  elseif(evac_host_platform_macos)
    set_target_properties(${lib_name} PROPERTIES IMPORTED_LOCATION ${CMAKE_CURRENT_SOURCE_DIR}/ext/${id}/macos/${id}.${ext})
  elseif(evac_host_platform_windows)
    set_target_properties(${lib_name} PROPERTIES IMPORTED_LOCATION ${CMAKE_CURRENT_SOURCE_DIR}/ext/${id}/windows/${id}.${ext})
  endif()

  target_link_libraries(${bin_name} PRIVATE ${lib_name})
endmacro()
And the usage code looks like:
_evac_baked_lib(evac_pc yyjson_pc yyjson a)
The resulting build run?
________________________________________________________
Executed in    3.53 secs    fish           external
   usr time   51.07 secs    0.00 micros   51.07 secs
   sys time    7.77 secs  273.00 micros    7.77 secs
Not bad! A simple change nets us almost 2 seconds for no real effort. Not all wins will be this easy, of course. The more important part here is how valuable having the data is to guiding our process. Once we had a visualization, we could immediately see the issue.
With a tall nail out of the way, we can use the sorting script I provided to examine the state of things. This (ab)uses the structure of the json format, giving each top level module an incrementing thread id based on their duration, starting at time 0, so we can view an aligned, ordered list of problems with the highest magnitude at the top.
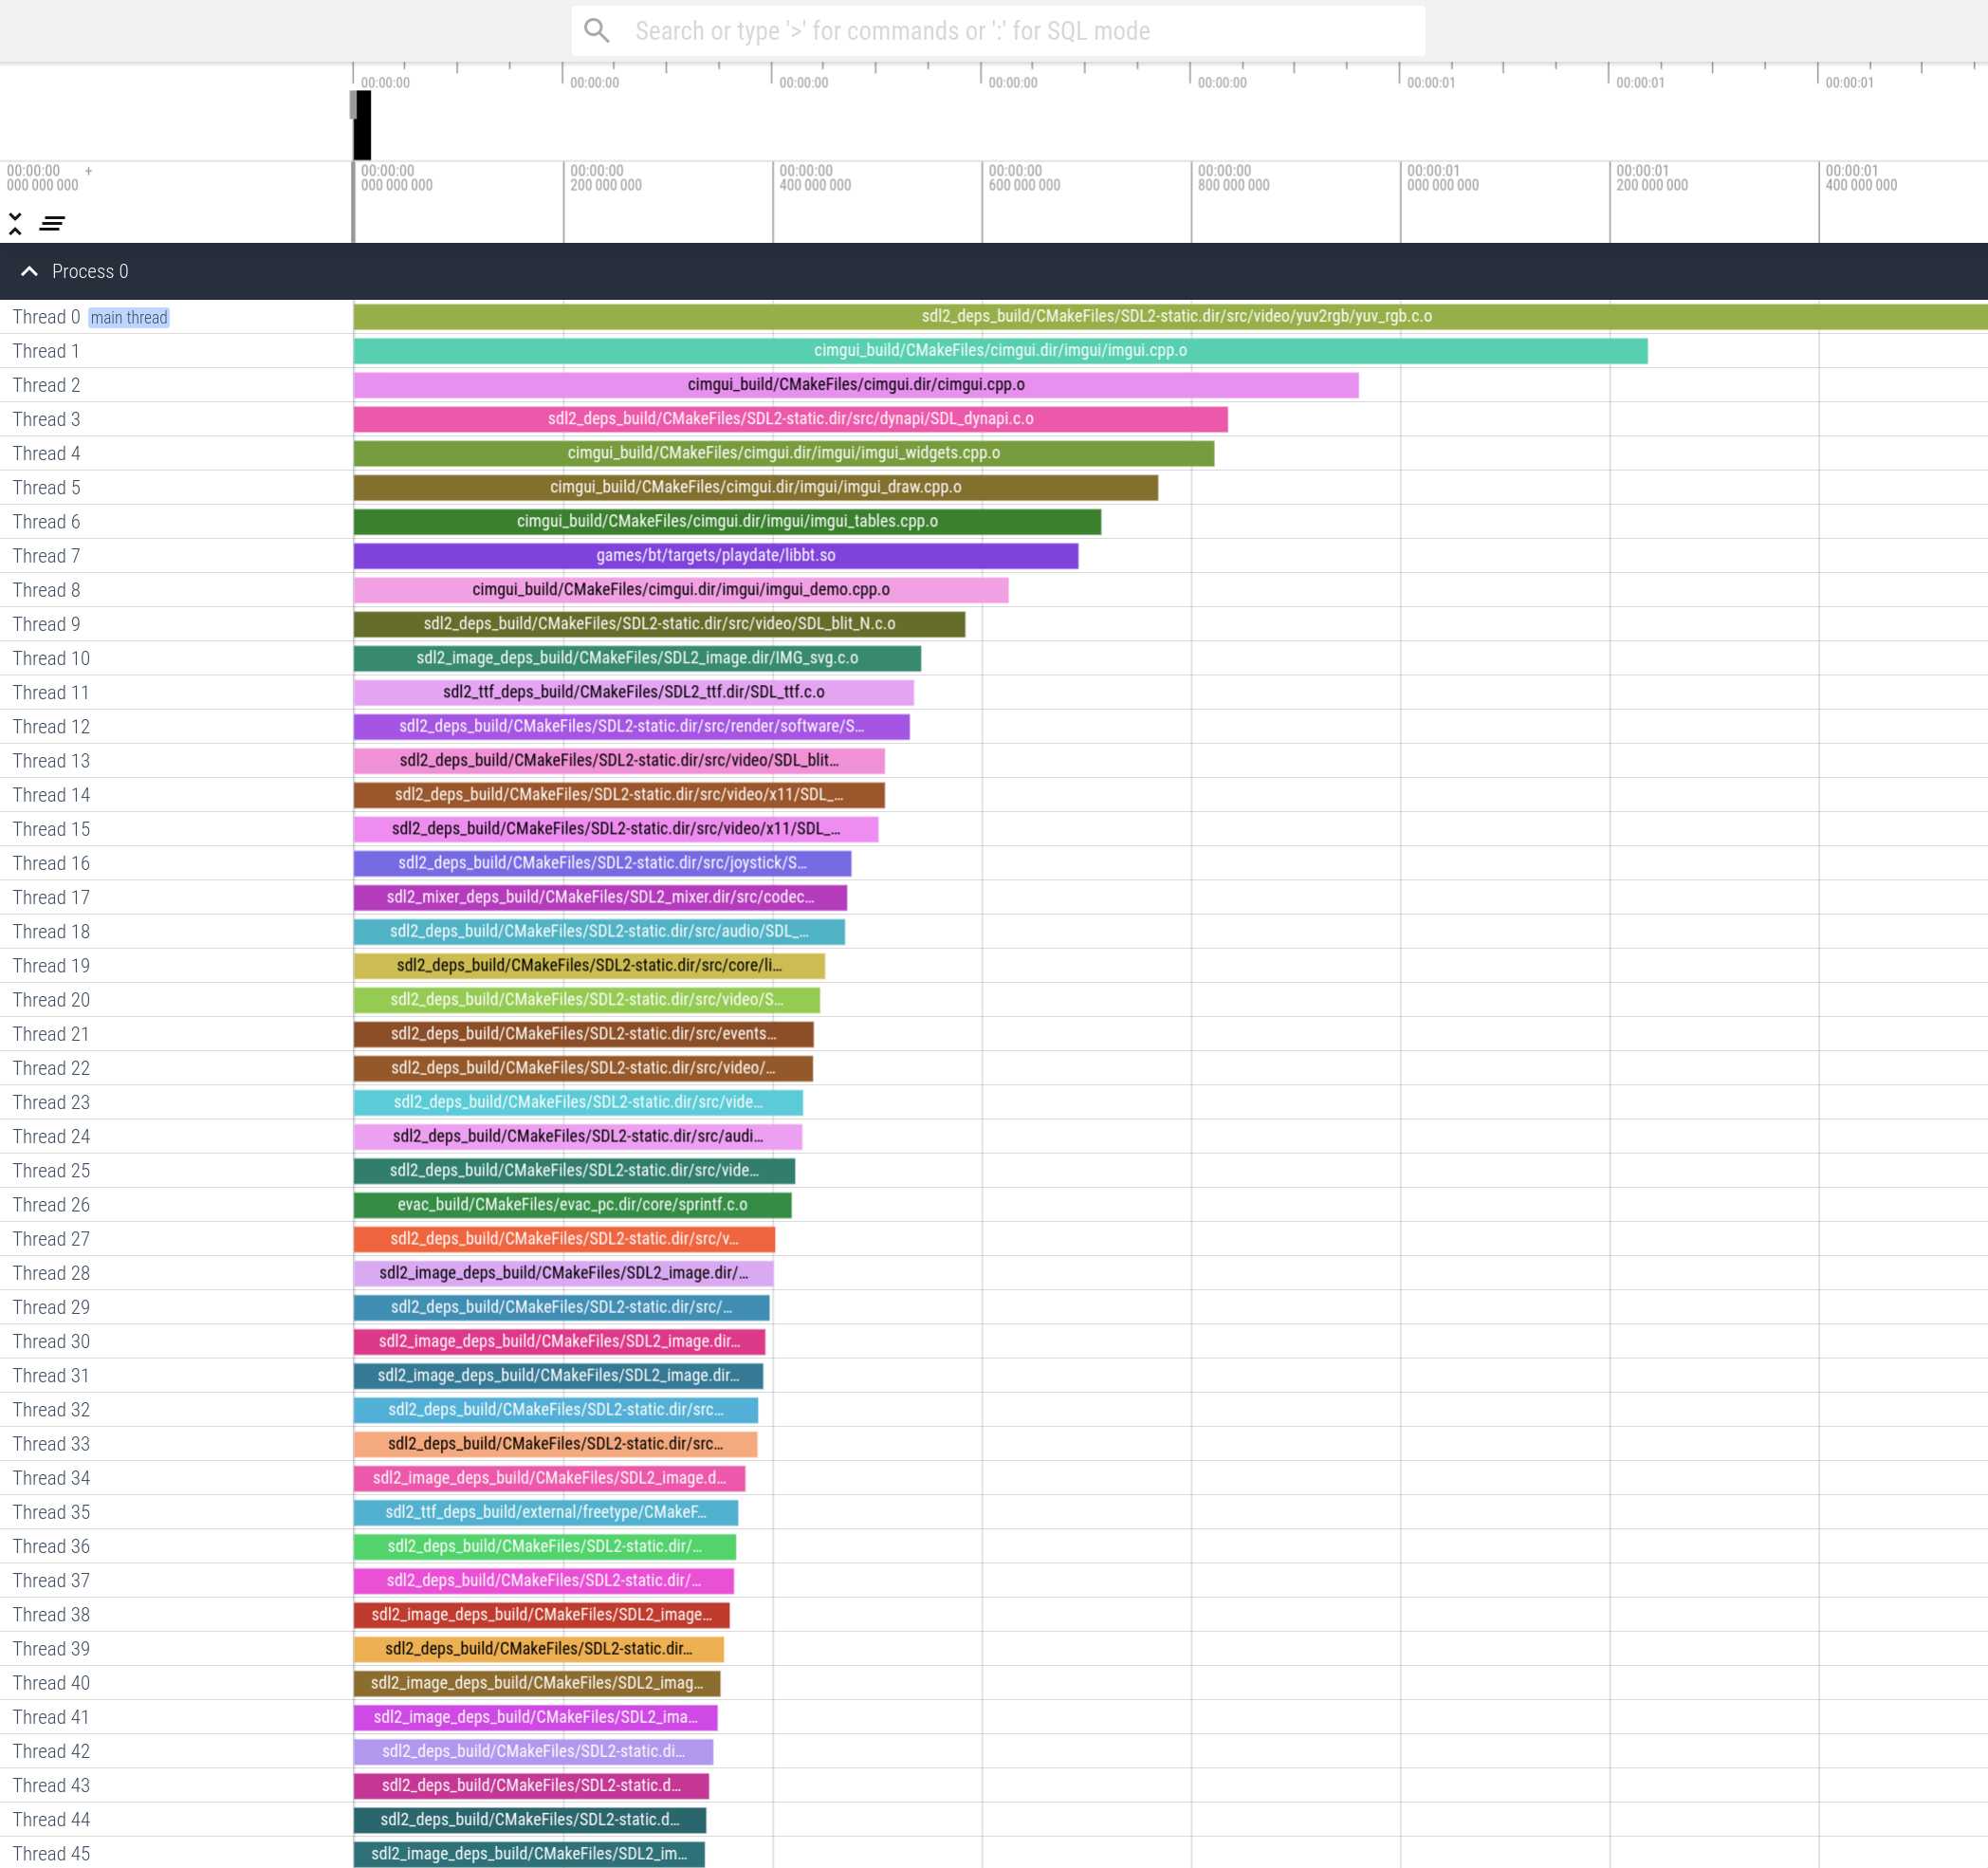
This brings out the second easy win that is common in many builds. Libraries that are available at the
system level, like SDL2 (which also recommends dynamically linking https://wiki.libsdl.org/SDL2/README/dynapi),
can be grabbed as dynamic libraries via your local package manager. It is nice to have the option to statically
link for certain platforms, but it generally shouldnt be the default for these kind of things, particularly
for day to day developer workflow. Below is the cmake code for my usage of SDL2, evac_pc is the core
engine library which games pull in. This behavior gets exposed through a flag provided to
cmake EVAC_USE_SYSTEM_SDL2, I find this is useful for retaining the option to statically
link easily from a local/vendored build.
if (_evac_dynlink_sdl2)
  message(STATUS, " [%%] Dynamically linking SDL2 for EVAC")
  if (evac_host_platform_linux)
    target_link_libraries(evac_pc
                          PRIVATE SDL2::SDL2
                                  SDL2_ttf
                                  SDL2_mixer
                                  SDL2_image)
  else()
    target_link_libraries(evac_pc
                          PRIVATE SDL2::SDL2
                                  SDL2_ttf::SDL2_ttf
                                  SDL2_mixer::SDL2_mixer
                                  SDL2_image::SDL2_image)
  endif()
else()
  message(STATUS, " [%%] Statically linking SDL2 for EVAC")
  target_link_libraries(evac_pc
                        PRIVATE SDL2::SDL2-static
                                SDL2_ttf::SDL2_ttf-static
                                SDL2_mixer::SDL2_mixer-static
                                SDL2_image::SDL2_image-static)
endif()
This of course nets us a large win, we are doing much less stuff! While it is a bit obvious, its important to point out. I often see a large preference for static linking locally vendored source, and while I get it, it is important to consider the difference between deployed needs of software and development needs, they can be different and we can have both optimized for their uses.
$ cmake -DCMAKE_BUILD_TYPE=Debug -DEVAC_TRACE_BUILD_TIME=ON -DCMAKE_C_COMPILER=/usr/bin/clang -DCMAKE_CXX_COMPILER=/usr/bin/clang++ -DEVAC_USE_SYSTEM_SDL2=ON -GNinja ..

$ time ninja
________________________________________________________
Executed in    2.13 secs    fish           external
   usr time   11.28 secs    0.00 micros   11.28 secs
   sys time    2.62 secs  275.00 micros    2.62 secs
That nets us another ~1.5 seconds, again for very little work and no perceivable change to our workflow. Back to the data we go:
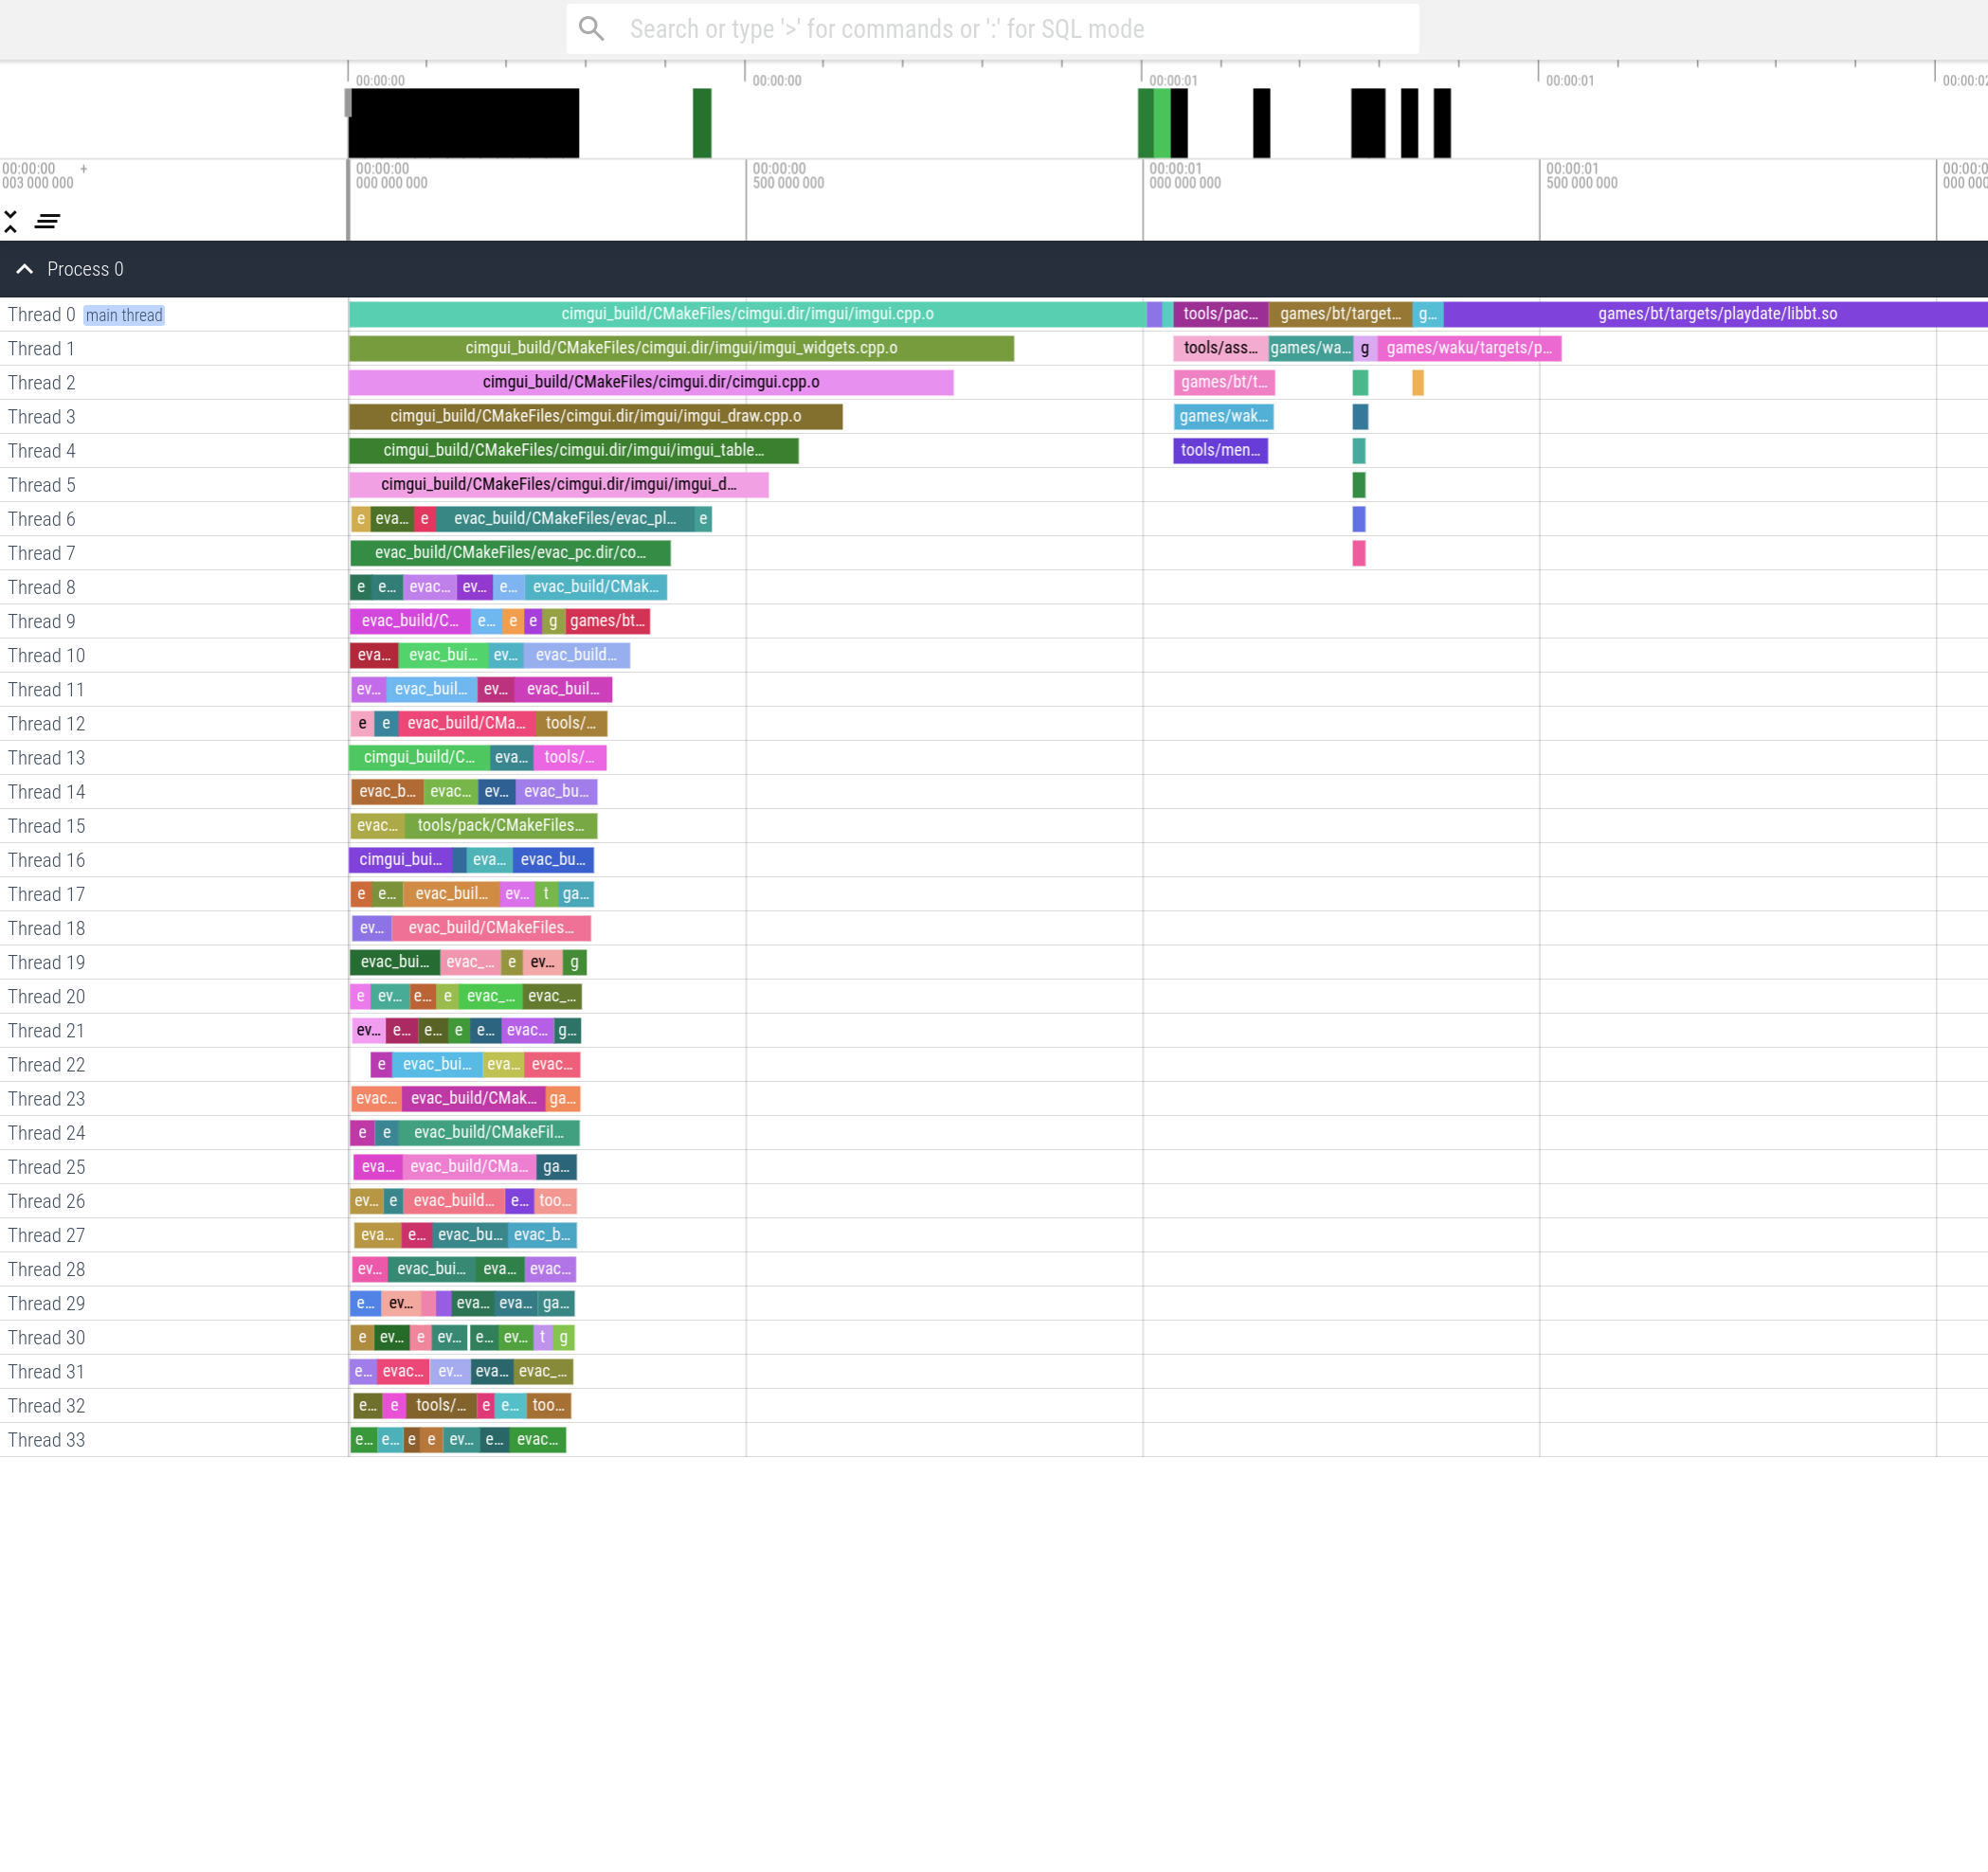
This leads us to the same conclusion we had for yyjson. I won’t be spending time changing ImGui,
its great, it doesn’t need my help :). So we bake it, it saves us another 0.8s. We find a similar win with
STB/sprintf.
A surprise detour
Now that we have tamed our dependencies3, we can focus on speeding up the build of our code. Right?
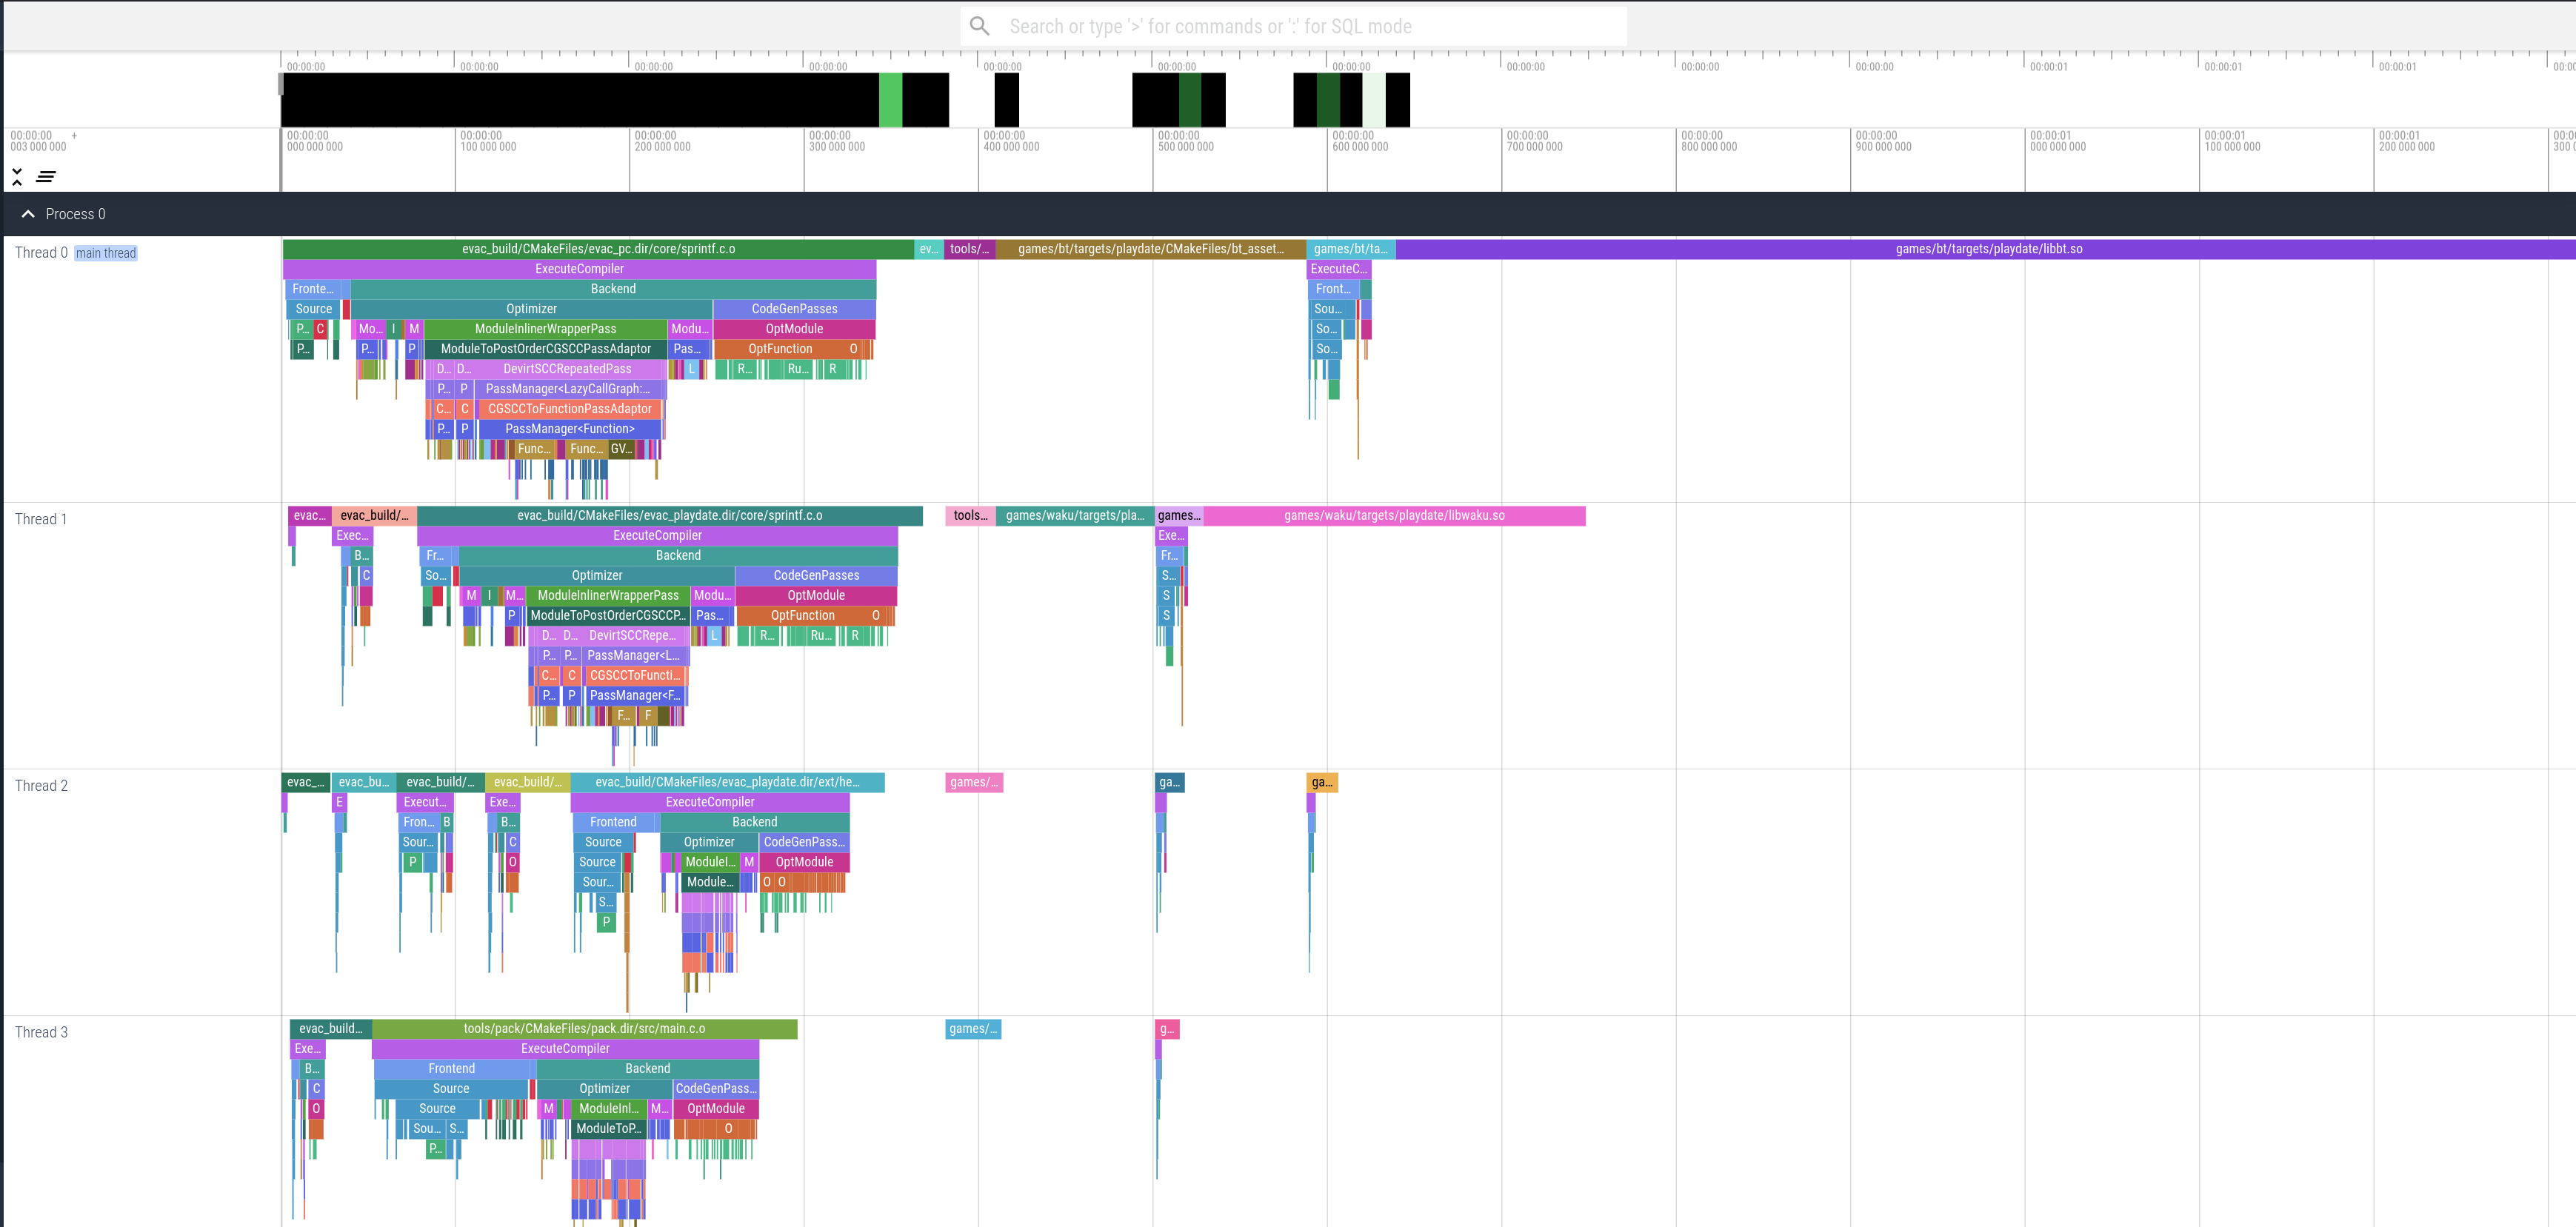
For this, we will run ninja tracing, but this time with different arguments. This embeds the information from
-ftime-trace below our top level modules, giving us a fuller picture. Before we look at those, we notice one
last clown.
python3 ninjatracing.py -e -g 500 .ninja_log > expanded.json
The end of the timeline shows one long and one extremely long bars (the pink and purple). At first I
thought they were running into some degenerate situation for the linker. So I ran it under perf.
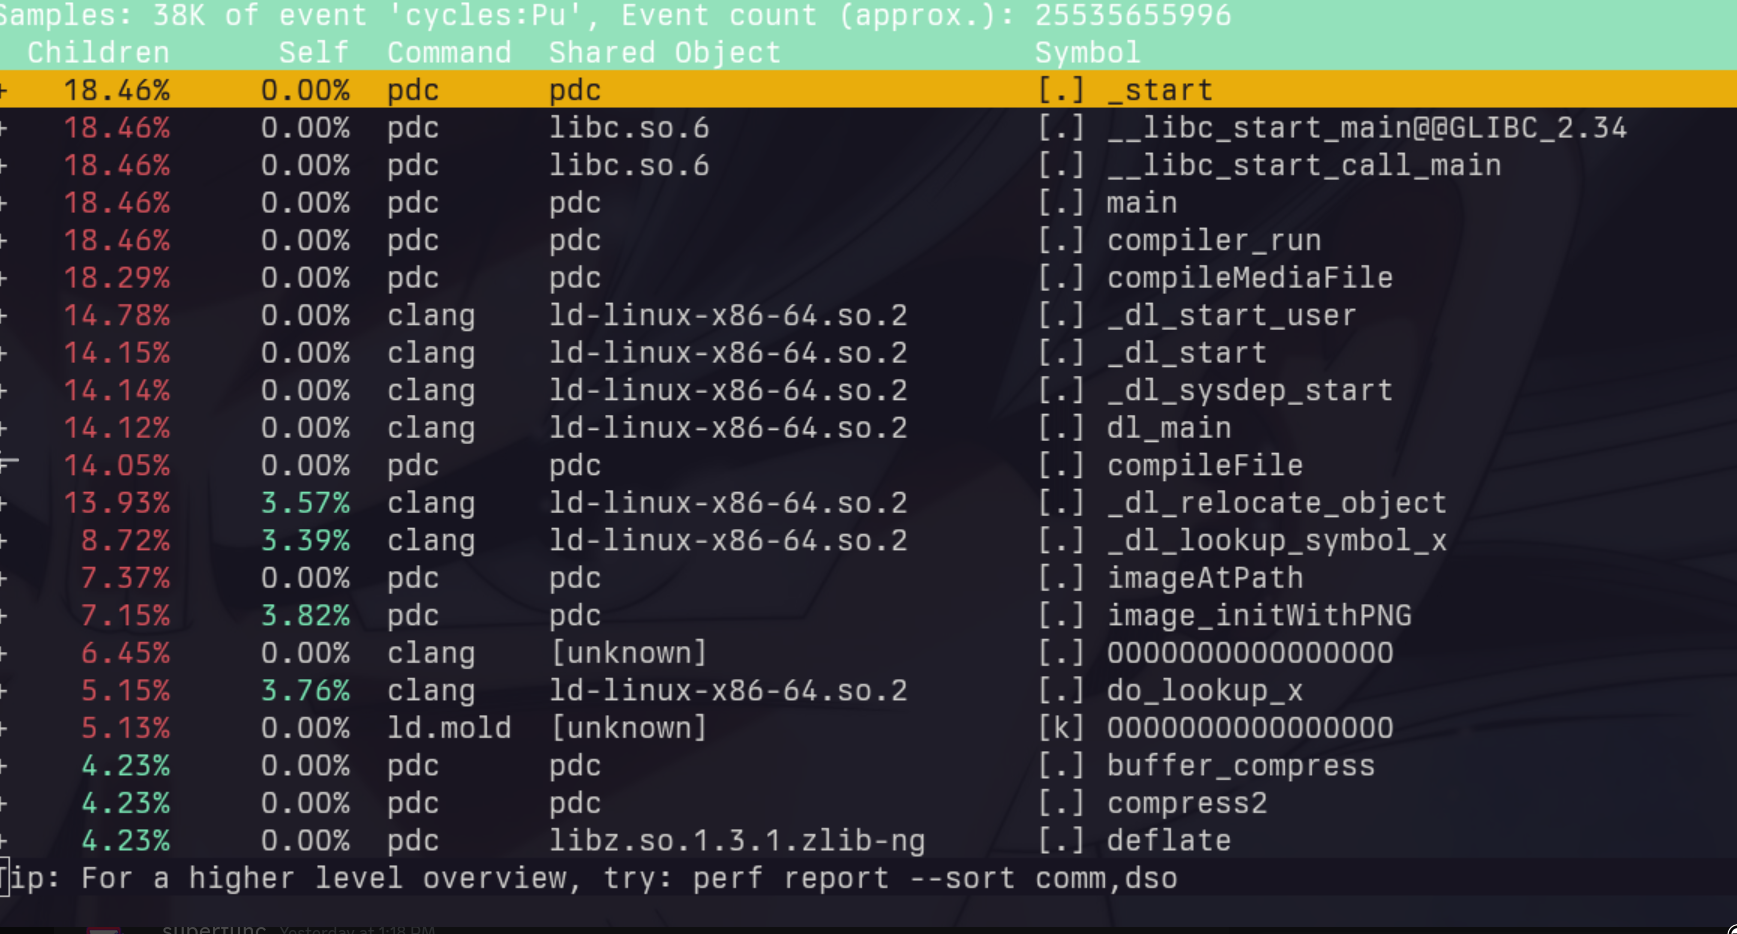
pdc is the Playdate SDK’s tool which converts assets to their on-device formats. When looking at the pink
and purple bars (representing two games I’m working on), I noticed that the time seemed to scale linearly
with the number of assets in the project. Sure enough, the pdc tool was scanning every file in those
directories and opening all of the media. Not a great strategy. So I replaced this with my own file watcher that
lives outside of the compiler/build system and just updates assets on the infrequent occasion they change.
This brings about an important performance lesson: consider the common case. It also reminds us that we
need to vet any build tooling brought in, their .cmake scripts activate pdc, so I wasn’t aware until
seeing this profile.
After removing this additional command:
________________________________________________________
Executed in  621.47 millis    fish           external
   usr time    5.86 secs    128.00 micros    5.86 secs
   sys time    2.06 secs     77.00 micros    2.06 secs
We have saved another 0.8 seconds, bringing us below a second to compile, and we haven’t even changed any code yet, nice!
Level 2: Code changes
There is a well known post from the old Our Machinery blog; it presents a maximalist view of header design in which no header includes anything but stddef/int/bool.
My approach when cleaning up headers was a slight relaxation on this, so I won’t say too much.
Beyond this, I applied the following set of rules
¬ Have a core header which sets sized typedefs from stddef.h and stdint.h.
¬ Headers can include each other from my library, but no outside libraries (so no SDL, ImGui, PlaydateSDK or C standard library headers show up in headers).
¬ Headers should only have type declarations and function prototypes. Two exceptions are macros for profiling and logging.
¬ No templates. In my testing they simply aren’t worth their compile time weight and error message. Moreover, code duplication hasn’t ever been an actual problem for me.
¬ No heavy headers, in either .c or .h files. Examples: anything from the STL, <stdarg.h>, <stdlib.h>.
This allows types to use one another without needing a forward-declaration and pointer indirection. And that’s really it. Following these kinds of rules, builds will naturally be fast. For my codebase, it resulted in a ~2x improvement on top of the previous results.
________________________________________________________
Executed in  325.99 millis    fish           external
   usr time    5.03 secs    139.00 micros    5.03 secs
   sys time    1.89 secs     74.00 micros    1.89 secs
When measuring your own code, the high level operation is to look at the sub trees generated below each module. For each with a large “front end” section, header cleanup is in order. Large “back end” sections imply the optimizer is taking a while to chew through the code, which is its own subject for a future post.
Additional CMake Notes
¬ CMake won’t de-duplicate generation of particular .o files across projects, so it is worth
bundling these into a library via add_library and having your executables link this in to avoid
a significant amount of redundant work.
Toolchain Notes
¬ Make is significantly slower than ninja in my testing. Visual Studio’s solution is as well. Ninja has by far the fastest change detection and pruning for telling the underlying compiler what to build.
¬ For compilers, clang is the only one I will bother with these days. Microsoft treats MSVC like a neglected hobby project (https://en.cppreference.com/w/c/compiler_support/23), particularly if you use C moreso than C++. Moreover, the error coverage is laughable compared to clang, its genuinely just not worth the time now that clang works across platforms (unless you need MSVC for things like targeting Xbox, of course).
¬ For linking I have one recommendation for *nix users, use Mold. Once build times are under control, linking becomes even more important. In incremental rebuilds (the common case), linking takes up a much larger share of the time. Also, if possible, please throw some financial support the developers way. It is a massive leap over Gold, Ld, and Lld in terms of performance. How Epic or any of the other money printers with tools comprised of a butt ton of DLLs hasn’t paid Rui to finish Windows support is beyond me.
Closing
With some careful planning and consideration, build times can be very fast.
¬ Measure it, then automate that measurement (example)
¬ Keep your headers free of superfluous and heavy includes.
¬ Ensure things running in the build actually need to be part of the build.
¬ Bake heavy build items that are rarely changing.
¬ Use system packages for commonly distributed libraries, at least for dev workflow.
With the clowns out of the car, we can look into what our newfound agility enables. Next time :)
Footnotes
1: An homage to the prolific shmup developers, CAVE
2: I’ve seen 3+ hour clean builds in my career, so trust me, it can get much worse.
3: An implied part of Level 1 is to very carefully select dependencies, use few, and run from anything with “Modern C++” in the readme)
4: I’ll try to expand on this point in the next post, covering a fork I made for a popular hot reloading library.